|
Manual
|
Run Diagnostics and Details - Velocity Data:
Before
experimental data can be analyzed, the data needs to be edited with the
UltraScan editing
module. In order to provide you with maximum convenience and user
friendliness, UltraScan
will automatically execute any functions which can be implemented without
user intervention. These functions include certain diagnostics and
analyses. To inform you of the results of these automated functions,
UltraScan will
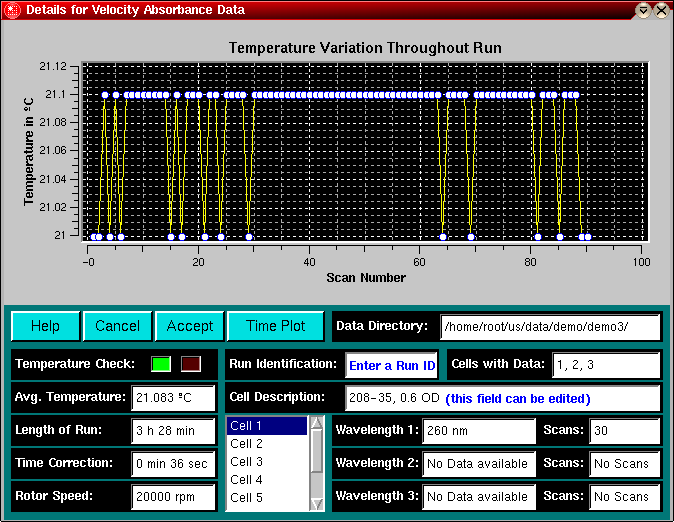
display the Run Diagnostics/Run Detail window after an experimental data
directory has been specified, or after an edited run has been loaded
by a data analysis routine:

This window will inform you about all the salient features of a
particular experiment and allow you to assign a unique run identification
to the experiment that will be associated with all data analyses performed
later on, as well as any result data files that will be derived from
this data.
- Temperature Variation: This
plot window shows you the temperature of each scan acquired during the
experiment. The purpose of this plot is to inform you if a temperature
variation during this run has occured that exceeds the temperature
tolerance setting in the configuration file
of UltraScan. It is
important for velocity data that the temperature of the run does not
vary over the course of the run for the following reason: A variation in
temperature will affect the viscosity and density of the buffer/sample
solution which cannot be compensated for in the data analysis. This will
cause the S-value of the sample to vary during the course of the run,
and most definitely introduce undesired inaccuracies in the results.
Clicking on the "Time Plot" button will present you with a
plot of the time differences between scans. The "Time Plot" button will
then change to a "Speed Plot" button. Clicking on the "Speed Plot" button
will then show you a plot of the speed at which each
scan was recorded. Finally, you can recall the
temperature plot by clicking on the "Temp. Plot" button, and cycle
through the different plots by repeatedly clicking on the same button.
- Temperature Check: If the temperature check has been exceeded
during the run, this LCD will show a flashing red light, otherwise,
the LCD will display a constant green light.
- Help Button: clicking on this button will bring up this
page.
- Cancel Button: After selecting the incorrect directory,
or to abandon the analysis of the selected run, you can press the
"Cancel" button to abort. You can also press this button to
close the Details window if it was opened as part of loading an edited
velocity dataset.
- Accept Button: After entering the Run Identification of the
selected data, you can click on the "Accept" button to return
to the main editing window. If you fail to enter a Run Identification,
a reminder will pop up to prompt you to enter
a Run Identification before proceeding. If this window is called from
a data analysis window, the "Cancel" and "Accept" buttons
simply close the window.
- Data Directory: This is the location where the experimental
data acquired by the Beckman Data Acquisition program is located.
- Run Identification: This is an editable field that allows
you to enter a unique run identification for your experiment. This
identification will be associated with all data analyses performed
later on, as well as any result data files that will be derived from
this data. Before allowing you to proceed, UltraScan requires that this
field has a valid entry. A valid entry is any alphanumeric character,
except a space (" "). If you fail to enter a Run Identification, a reminder will pop up to prompt you to enter a Run
Identification before proceeding. If this window is called from a data
analysis window, this field can't be edited and simply will display the
Run Identification that was entered during the editing process.
- Cells with Data: This field will indicate which cell
position(s) in the rotor where acquired in the experiment. Valid numbers:
1-8. In velocity runs, cell #8 is reserved for the counterbalance.
- Avg. Temperature: The average temperature of the run resulting
from all scans in the experiment.
- Time Correction: The time correction resulting from the
rotor acceleration period. Subtracting this number from the time of the
run will result in the theoretical time that would have been observed
if it would have been possible to start the run at exactly the rotor
speed setting from the experiment. During the acceleration period the
rotor is not spinning at constant speed, so a time correction is a good
way to correct for that. It is obtained by subtracting the time of the
scan from the Omega-square-t value recorded in the scan file.
- Length of Run: The time point at which the last scan of the
experiment was taken.
- Rotor Speed: The rotor speed setting of the experiment.
- Cell Description: This is the description of the cell contents
that were entered at the time of data acquisition. This field is editable
and you can update or change this information at this time. When this
window is called from a data analysis window, any changes in this field
will remain without effect.
- Cell Listbox: This box allows you to review the Cell
Description, Wavelengths and Scans acqired for each
cell. As you scroll through this box and click on individual cells,
the information in the respective fields will be updated for you to
review.
- Wavelengths: The wavelength selection for the data. For
absorbance data, there are up to 3 different selections available.
- Scans: The number of scans for each wavelength acquired.
www contact: Borries Demeler
This document is part of the UltraScan Software Documentation
distribution.
Copyright © notice.
The latest version of this document can always be found at:
http://www.ultrascan.uthscsa.edu
Last modified on January 12, 2003.


