
|
|
Manual |
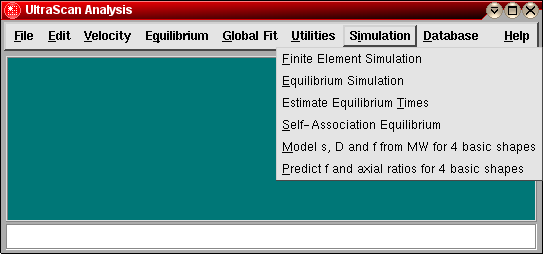
You start the Self-Association Equilibrium Simulator by clicking on "Self-Association Equilibrium" in the Simulation sub-menu of the main menu. The main Self-Association Simulator window will appear. This software assumes that you concentration values are in molar units. if you are using different concentration units, you need to convert your association constants to molar units first.
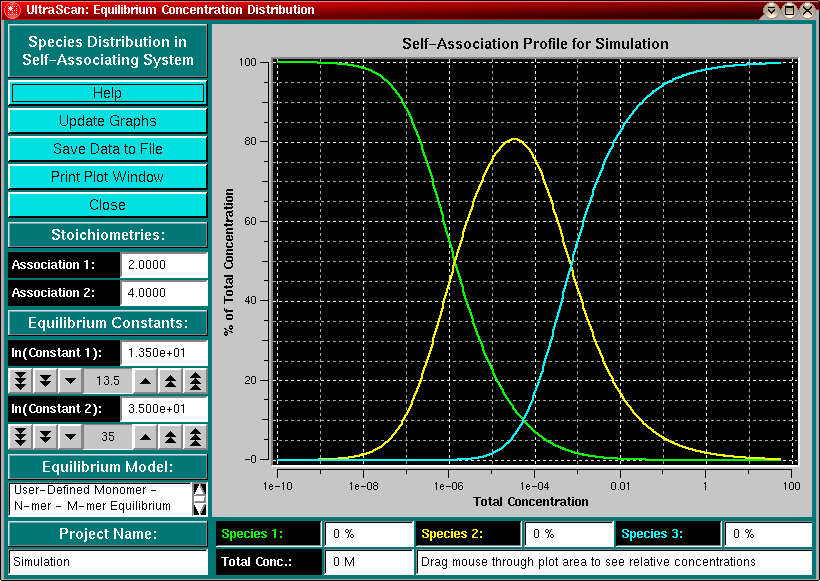
This program allows you to simulate the relative amounts of monomer,
dimer and tetramer species present in a self-association equilibrium. When
you set the logarithm of the corresponding equilibrium constant by clicking
on the arrows of the counter widgets, the program will calculate the distribution
of each species using a root-finding algorithm.
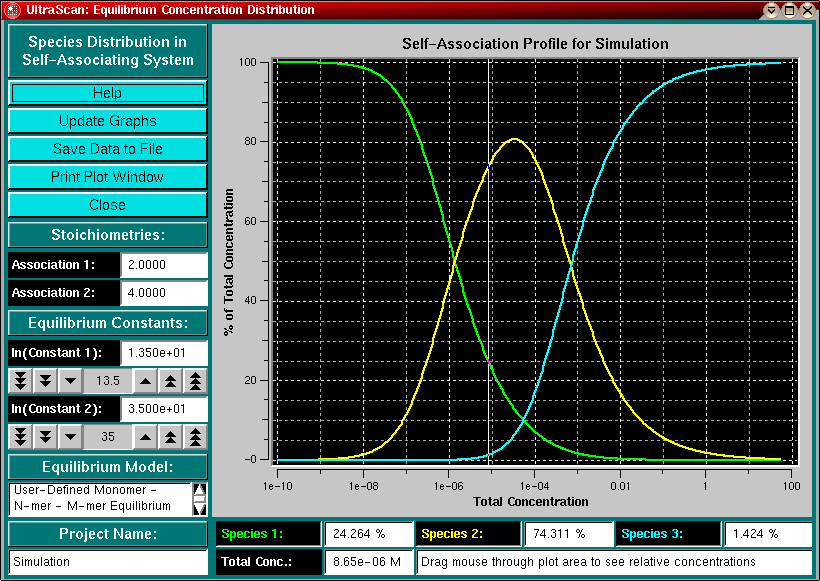
Clicking in the plot area will draw a vertical bar corresponding to
the concentration at that position and display the
relative amounts of each species in the corresponding label.
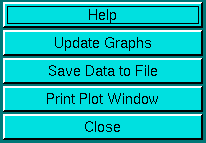
Clicking on the "Write Data to File" button will create an ASCII data file with the relative concentrations of each species over the concentration range from 1 x 10⁻¹⁰ molar to 1 x 10² molar. The data points are logarithmically spaced. Click here for file format information.
Explanation of Buttons and Fields:
|
|
|
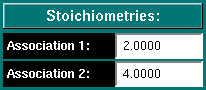
Stoichiometries for a two component model - these fields allow you to enter any stoichiometry for your association equilibrium. Fractional values are allowed. If you invoked this routine from a fitting panel of the self-associating model fitter, the values are read-only and cannot be changed. |
|
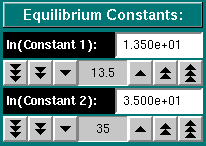
Equilibrium constants - Use the counter buttons to change the value of the equilibrium constant (in molar units). The values shown are listed as the natural log of the association constant. The 1/2/3 arrow buttons adjust the value in steps of powers of 10. If you invoked this routine from a fitting panel of the self-associating model fitter, the values are read-only and cannot be changed. |
|
|
|
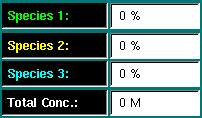
Species Indicator - The species indicators list the percentage of concentration contributed by each species (monomer, n-mer, m-mer) to the total concentration. You can drag the mouse through the plot area and a white vertical bar will indicate the total concentration. The relative amount of each species will be listed in the species fields. |
This document is part of the UltraScan Software Documentation
distribution.
Copyright © notice.
The latest version of this document can always be found at:
Last modified on January 12, 2003.