 |
Manual
|
2-dimensional Spectrum Analysis Grid Control Module:
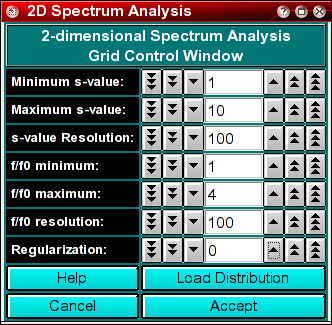
The 2-dimensional spectrum analysis grid control module is used to select the parameters
needed in a grid-based analysis using the 2-dimensional spectrum analysis method.
The method supports a global analysis of multiple datasets, and parameters selected
here apply to all datasets included in the analysis. For example, an experiment
of multiple components has been done at multiple speeds. Each speed can provide
a dataset to the global analysis of this system.
Analysis Parameters:
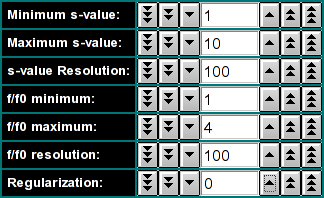 |
Minimum/Maximum s-value:This controls the
s-value range examined in the spectrum analysis. If distribution
was loaded, these values will be
will be automatically initialized to reasonable values,
otherwise they will need to be manually adjusted by the user. The larger
the range, the more points will be needed to cover a sufficiently narrow
grid for the analysis.
s-value Resolution: This value controls the number of divisions made
in the s-value range.
f/f0 Minimum/Maximum: This controls the frictional ratio range
examined in the spectrum analysis. The default setting is to search
a space between an f/f0 range between 1 and 4. The larger the range,
the more points will be needed to cover a sufficiently narrow grid for
the analysis. Globular proteins often can be fitted with values less
than 2.5. Random coil and DNA molecules, as well as aggregates often
need higher f/f0 values. If a previous spectrum
analysis distribution was loaded, these values will be initialized
automatically to the values derived from the loaded distribution.
f/f0 resolution: This value controls the number of divisions
made in the f/f0 ratio range.
|
Control Functions:
 |
Help: This help file
Load Distribution: The average temperature calculated from the entire run
Cancel: Close the control module window.
Accept Accept the current settings for the analysis
|
www contact: Borries Demeler
This document is part of the UltraScan Software Documentation
distribution.
Copyright © notice.
The latest version of this document can always be found at:
http://www.ultrascan.uthscsa.edu
Last modified on November 27, 2005.