
|
Manual |
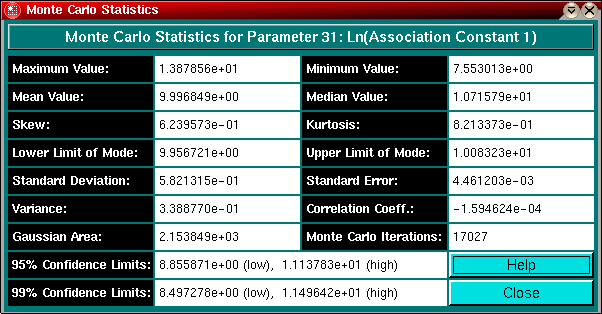
Monte Carlo Statistics:

This panel shows the various statistical measurements for the Monte Carlo distributions of each parameter.
Explanation of Fields:
Variables used: u is the mean data value (see below), N refers to the number of observations, and xi is the observation i.

Extreme values can have a large impact on the mean, so the median is often preferrable for skewed distributions such as the Lognormal distribution. If the distribution is symmetric (like the Normal distribution), then the mean and median will be identical."
The key is that last sentence. IF the distribution is symmetric, then the median will happen to be the same as (Max+Min)/2 in addition to the mean. But that is generally not the case for Monte Carlo simulations. The values of Min and Max can vary dramatically (even when the distribution is symmetric), but the median does not depend upon the minimum and maximum values, only the middle point.
This value should be close to the mean and the mode, if not, the distribution may be skewed.


A smaller variance is better.

This is a standard measure of the spread in data values. The larger the value of sigma, the larger is the spread in data. If data are normally distributed, sigma as calculated by Eq.(5) can be substituted in Eq.(1) to find the probability for a particular data value. The smaller the standard deviation, the higher is the confidence in the estimated value.
For real variations in properties between multiple samples, the limits specify a range in which it is likely to measure some percentage of data values. For example, one can specify limits so that one nine of every ten measurements are likely to fall within the range of values between those limits; this would be a 90% confidence level. A 99% confidence level, where on average 99 out of 100 measurements would be found, would require larger confidence limits. To be sure that each measurement fell within some range of values (a 100% confidence level) would require limits of plus and minus infinity; in other words statistically you can never be 100% sure of your answer or possible range of data values!
Obtaining confidence limits depends on the data distribution. For a normal probability these limits are reasonably straight-forward to obtain. If the kurtosis and skew of the distribution are close to zero, the distribution is similar to a normal distribution and the confidence limits represent a good measure of the error range. For example, say we have a normal distribution with some mean u and a standard deviation of sigma. The probability of measuring a data value between 2 x sigma and 3 x sigma would be

The limits for a particular confidence level for a normal distribution are simply the limits of integration on either side of the mean needed so that the integral covers the desired area. For example, for a 95% confidence level we need to find the upper and lower limits so that 95% of the area under the curve falls between these two points. The equation for this is

where +/-limit are referred to as the confidence limits, measured in standard deviations. The desired confidence limit in percentage can be looked up in tables, for a 95% confidence interval, the limit should be about 1.96 standard deviations around the mean, for a 99% interval the limit should be about 2.576 standard deviations around the mean.
For more information see also:
Wittwer, J.W., "Monte Carlo Simulation in Excel: A Practical Guide" From Vertex42.com, June 1, 2004, http://vertex42.com/ExcelArticles/mc/
This document is part of the UltraScan Software
Documentation distribution.
Copyright © notice
The latest version of this document can always be found at:
Last modified on January 12, 2003.