 |
Manual |

Oftentimes you may know the extinction coefficient of a protein at 280 nm from previous measurements or based on an estimate from the protein sequence by the method of Gill and von Hippel. However, estimating the extinction coefficients at different wavelengths involves cumbersome absorbance measurements and calculations, which have to be repeated for each individual wavelength.
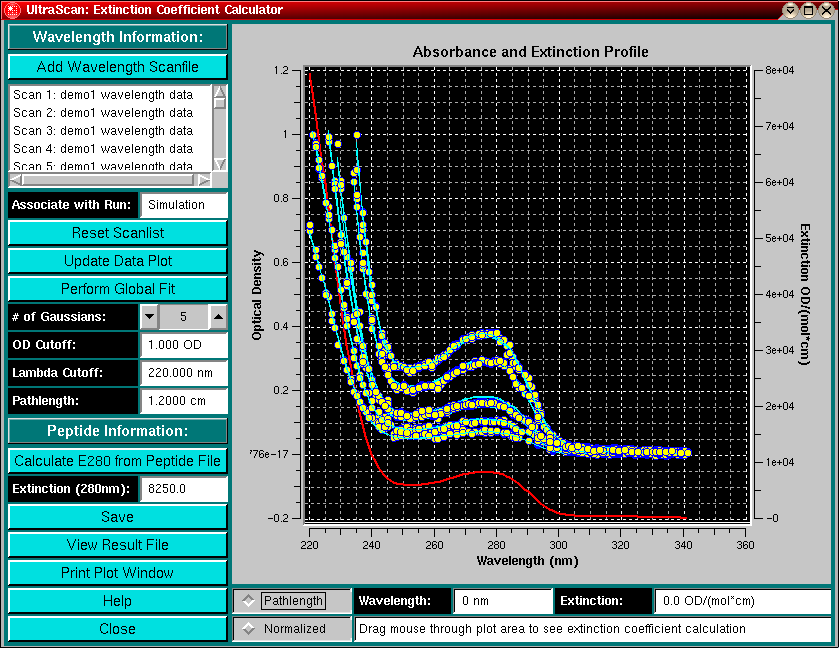
A simple approach to determine the extinction coefficients of a protein at wavelenghts different from 280 is to measure the absorbance of the protein over a larger wavelength range at multiple concentrations and then fit the data globally to a "best-fit" extinction function that describes the protein's extinction properties at each wavelength. The approach chosen in this module is to measure the absorbance profile of a protein at several different concentrations over the wavelength range of interest, which can easily be accomplished with the XLA. The resulting wavelength scans are then fit to a global extinction profile using sums of Gaussians, which are weighted by multipliers, representing the concentration of the sample in each scan.
The need for this capability becomes apparent when one analyzes self-associating systems with the equilibrium technique. In such cases it is advantageous to examine the sample over a large concentration range in order to obtain signal from all species present. This often requires measurements at different wavelengths (typically 208-212 nm, 230 nm, 278 nm and 280 nm), where the protein exhibit different extinction properties. On occasion, proteins contain chromophores in the visible range (i.e., heme-containing proteins), which could also be utilized.
The program will crop valid data (within reasonable absorption limits, generally 0.0 - 0.9 OD) from each wavelength scan and fit it with a global fitting function composed of sums of Gaussian distributions with different amplitudes, peak positions and peak widths. The global function is then multiplied with a floating scalar which represents the concentration of the scan's sample.
Once a suitable fitting function has been found, a common extinction profile is extracted and normalized with a single, known wavelength extinction coefficient, typically estimated from sequence at 280 nm by the method of Gill and von Hippel (Anal. Biochem. 182:319-326, 1989). The pathlength of the sample cell can also be taken into account.
A summation of Gaussian terms is a natural choice for the extincion function, since it should represent the absorbance peaks of the protein. In most cases it is sufficient to fit the data at hand to a sum of 4-5 Gaussians, determining in each case the value of the position, width and amplitude of each Gaussian peak by nonlinear least squares estimation.
Multiple wavelength scans of the same protein at different concentration will highlight different absorbance peaks and, when fitted globally, will generate a unique function describing the absorption/extinction properties of the protein.
Experimental Design:
The nonlinear least squared global fitting of wavelength scans to a unique extinction profile requires a prudent choice for scans at the correct concentration and wavelength range to be fitted. Multiple dilutions of the sample should be prepared that provide an optical density of about 0.3, 0.6 and 0.9 at the wavelengths of interests. All samples should be scanned over the entire wavelength range. Absorption regions that exceed a certain threshold value (typically 0.9 - 1.0 OD) can automatically be excluded from the fit to avoid problems with nonlinearity of absorption. Overlapping wavelength regions allow the program to properly correlate all concentrations to eachother. 7 different samples can be prepared in an 8-hole rotor, or 6-channel centerpieces can be used and be scanned at different positions in order to generate all needed wavelengths scans in a single run.
Explanation of fields and buttons:

|
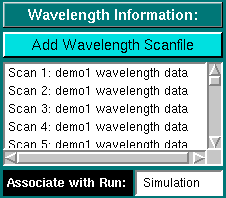
Add Wavelength Scanfile | Click here to add new scanfiles to the fit. You will need at least two scanfiles for a global fit. The more scan information is available, the more reliable will be the fit. Try to include scanfiles covering each wavelength of interest with multiple concentrations in a range where the XLA spectrophotometer provides linear output (typically 0.0 - 0.9 OD). You can select multiple files at once in the filedialog. Both uppercase and lowercase wavelength scans will be listed. |
| Associate with Run: | This is the run ID used when calling the fitting program from the Equilibrium Global Nonlinear Least Squares fitting program. When returning to the equilibrium fitting module, scans derived from this run ID can automatically have their extinction coefficients adjusted according to their wavelengths. By changing this name, you can fit protein absorbance scans for multiple components that may have been measured in different runs and have the extinction coefficients of the associated equilibrium scans automatically adjusted. | |

|
Reset Scanlist | Clicking on this button will reset the scan list and blank all listed scans. You will have to add new scans before proceeding with a fit. |
| Update Data Plot | Click on this button to update the data plot after some parameters have be andjusted or changed. Parameters that affect the display of the plot and require a data plot update are: OD Cutoff, Lambda Cutoff, Pathlength, Pathlength display (normalized or pathlength), and an adjustment of the 280 nm extinction coefficient. | |
| Perform Global Fit | After selecting all scans to be included in this fit, click here to start the nonlinear least square fitting process. The Extinction Fitter Control Panel will be displayed. For more information on nonlinear least squares fitting, please click here. After fitting, the scans will be displayed with the best fit overlayed. Residuals of the fit can be displayed as well. Residuals and overlays can be toggled by clicking alternately on the "Residuals" or "Overlays" buttons. | |

|
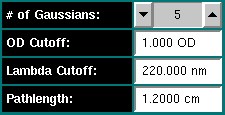
Number of Gaussians | This is the number of Gaussian terms used in the global fit. The more terms are used, the more degenerate the fit will be, but the better the residuals. Including too many terms may cause the nonlinear least squares fitting algorithm to fail because the information matrix may turn singular. |
| OD Cutoff | The OD Cutoff is the optical density above which data is ignored. Since the spectrophotometer produces a nonlinear signal above a certain optical density, it is generally a good idea to clip data above 0.9 - 1.0 OD. This data will not be used in the fit and will not be displayed. | |
| Lambda Cutoff | With this field you can eliminate data below a certain wavelength. | |
| Pathlength | In this field you can enter the pathlength of the cell which was used for the wavelength scans. The program will automatically correct the extinction coefficient to the given pathlength. | |

|
Calculate E280 from Peptide File | Clicking on this button will call up the Peptide Calculation Module, which allows you to estimate an extinction coefficient for 280 nm based on the method by Gill and von Hippel for measuring the partial extinction of denatured peptides at 280 nm from the amino acid composition. By default, this value is set to unity, adjusting this value will scale the entire profile to an extinction value proportional to the 280 nm value. |
| Extinction (280 nm): | Instead of using the peptide extinction coefficient calculator, you can manually enter an extinction coefficient for 280 nm in this field. Your extinction coefficient could result from a mass-spec analysis or other protein analysis. | |

|
Save | Save the current fit to file. Two files will be saved: The first file contains the wvalength and extinction data, normalized by the E280 entry, in an X/Y-plot format (ASCII). The second file contains the fitting results for the linear combination of Gaussian terms. |
| View Result File | Clicking on this button will display the result files of the fit in a window from which you can print it to a printer: (see above for details) | |
| Print Plot Window | Clicking here will generate a postscript image that can be printed either to file or printer. | |
| Help | Display this help file. | |
| Close | Close the extinction calculation program and exit. | |

|
Pathlength | If selected, the wavelength scan data is shown in absorbance units corresponding to the pathlength. |
| Normalized | If selected, the wavelength scan data is shown in absorbance units normalized to a 1 cm pathlength. | |

|
Wavelength | If the mouse button is clicked and dragged through the plot area, this field will show the current wavelength coordinate. |

|
Extinction | If the mouse button is clicked and dragged through the plot area, this field will show the extinction calculation corresponding to the current wavelength coordinate. |
This document is part of the UltraScan Software Documentation
distribution.
Copyright © notice.
The latest version of this document can always be found at:
Last modified on January 12, 2003.