
|
Manual
|
Exporting Data - Velocity or Equilibrium Data:
Once you have edited experimental data with the editing module, you
can export the edited experimental data to a platform independent ASCII
formatted file. Such data can then be imported into other applications,
such as Microsoft Excell, Quattro Pro, Microcal Origin and other plotting
packages, regardless of architecture.
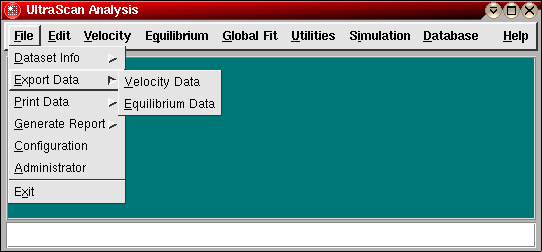
To export data, click on "Export Data" from
the File Menu on the UltraScan Main Menu. You can select from velocity
and equilibrium experiments. The program will display the the Export
Data window for either velocity or equilibrium data.
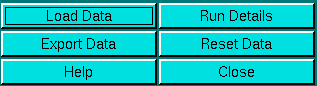
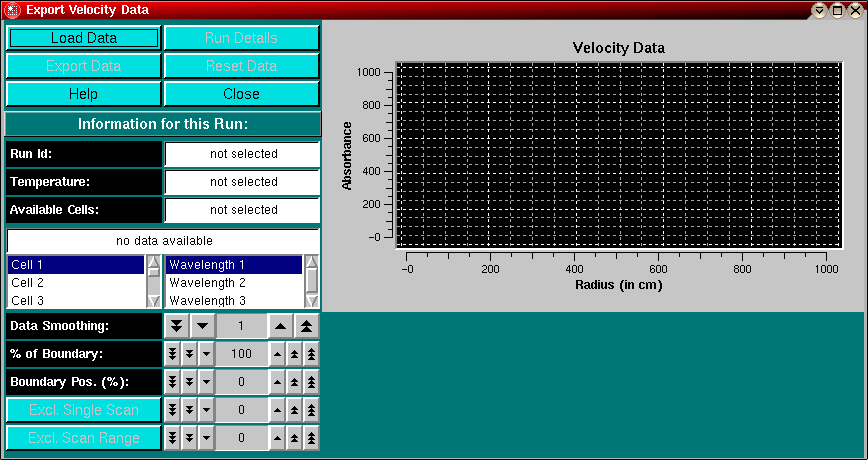
Run Control Functions:
 |
-
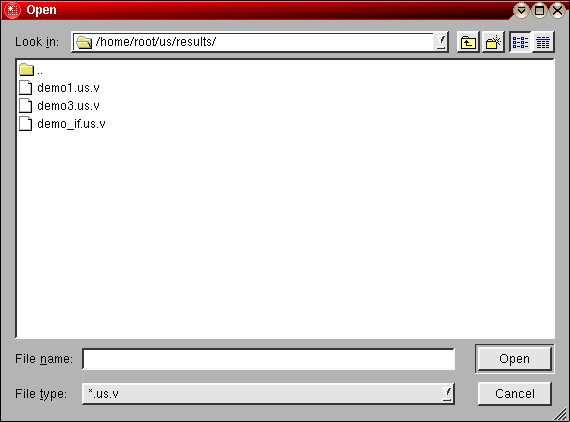
Load Data: Load edited data sets (with the *.us.v or *.us.e
suffix). A file dialogue will allow you to select
a previously edited velocity or equilibrium experiment. If you selected
"Velocity", only previously edited velocity experiments will be shown,
and the same for equilibrium runs. Once a run has been selected, the Run Details will be shown. Click on the
"Accept" or "Cancel" button, and the program will display
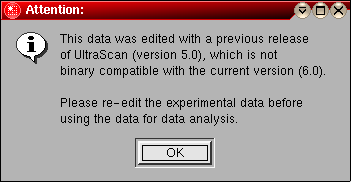
the first available dataset for this run in its entirety. If the data
was edited with an older version of UltraScan than the current, an error message will be displayed.
-
Run Details: View the diagnostic details for a
velocity or
equilibrium experiment.
- Export Data: This function allows you to export the data to
an externally readable ASCII format. Before exporting, you may wish to
use the various controls to customize the appearance of the exported data
(see below). The exported data will be saved in the "Results" directory
(see Configuration for details), the file format
is described here.
- Reset: Reset all display parameters to their default values.
-
Help: This help file
-
Close: Exit this module
|
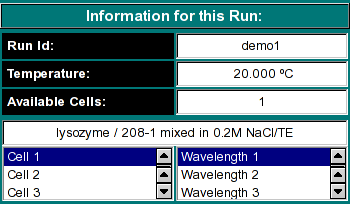
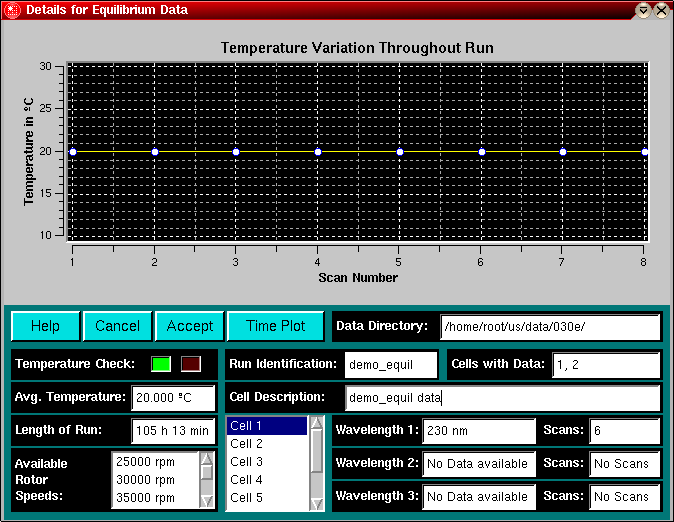
Run Information:
Equilibrium:
|
-
Run ID: The name of the run given during editing
-
Temperature: The average temperature calculated from the entire run
-
Available Cells: The numbers the cells that contain analyzable data
Clicking on a cell and wavelength selection will bring up the cell contents
description for that cell and wavelength. Scroll through this list to bring
up information for cells > 3. If there is no data available for the selected
cell, the program will list "No Data available". Selecting a cell/wavelength
combination will automatically bring up the corresponding dataset and present
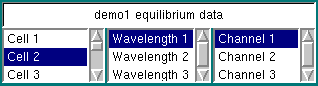
the analysis. For equilibrium scans, you can also select the
channels (for runs containing multi-channel centerpieces) |
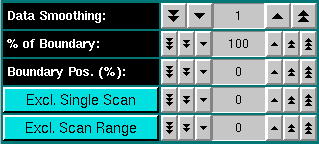
Changing Display Parameters:
 |
-
Data Smoothing: Use this feature to smooth the experimental data.
For noisy data, increasing this parameter can improve the clarity and appearance
of the results considerably. Please note: Whenever possible, especially
for very steep boundaries with low diffusion, try to avoid using too much
smoothing to prevent artificial modification of the boundary shape. Smoothing
is performed based on a frame average. The number shown represents the
size of the smoothing kernel used (the number of datapoints averaged for
a single point). The algorithm used is non-destructive of the original
data and hence the smoothing is reversible. Also, point smoothing is independent,
where the smoothing of one point does not have any effect on the smoothing
of its neighbors. Only unsmoothened points are used for the calculation
of the smoothed value. Each time you click on the counter, the current dataset
will be reset to the full dataset.
-
% of Boundary: This is the portion of the boundary used for the
analysis. 100 % refers to the entire boundary, reaching from the baseline
concentration value to the plateau concentration value. This portion is
shown in yellow in the experimental data plot. Excluded data is shown in
blue. Changing this number will automatically reset the position of the
analyzable portion of the boundary in the center of concentration between
the baseline and the plateau concentration.
-
Boundary Position (%): For percent-boundary values less than
100 %, this number refers to the percentage of total concentration by which
the remainder (=un-analyzed portion of the boundary) is shifted away from
the baseline. A value of 0% refers to a data analysis start at the baseline.
This number is always less than or equal to 100 % - (% of Boundary). It
allows you to control the position of the analyzed portion relative to
the baseline. The blue colored portion of a scan is excluded from the analysis,
and the yellow portion is analyzed.
-
Exlude Single Scan: When setting this counter to a non-zero value,
the respective scan will be highlighted in red. Clicking on "Excl. Single
Scan" while a scan is highlighted in red will delete this scan from the
analysis. Deleting scans from the analysis is irreversible and can only
be reset by clicking on the "Reset" button or by reloading the data (when
smoothing, the data is always automatically reloaded, causing the number
of scans to be reset to the original count).
-
Exclude Scan Range: Same as "Exclude Single Scan", except
for multiple scans. To use this feature, select first the start scan of
the range by using "Exclude Single Scan", then complete the scan
range by using "Exclude Scan Range".
|
www contact: Borries Demeler
This document is part of the UltraScan Software Documentation
distribution.
Copyright © notice.
The latest version of this document can always be found at:
http://www.ultrascan.uthscsa.edu
Last modified on January 12, 2003.