
|
Model Selection: To select a model, click on the "Select Model"
button. You can then select a predefined or user-defined model from a model selection dialog. Model selection is explained
in more detail here.
|
|
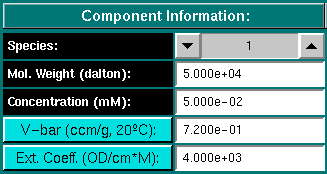
Component Information:
Species: For multiple component models you can use the arrow
button to select the desired component.
Mol. Weight (dalton): Enter the molecular weight for the conponent
selected above.
Concentration (mM): Enter the partial concentration in millimolar
for the component selected above.
V-bar (ccm/g, 20oC): Enter the partial specific volume
for the component selected above. Clicking on the button will load the
Vbar Calculation module, which allows you to estimate a
v-bar value from the amino acid composition specified in a protein sequence file.
Ext. Coeff. (OD/cm*M): Enter the extinction coefficient of the
component selected above for the the wavelength to be simulated. The units
for the extinction coefficient are measured in optical density units at
the selected wavelength per cm and mol. Clicking on the button will load the
peptide properties calculation module, which allows you to
estimate an extinction coefficient for the denatured protein at 280 nm
from the amino acid composition specified in a protein sequence file.
|
|
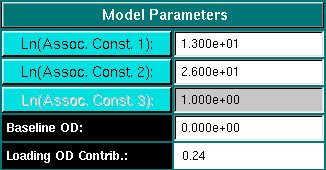
Model Parameters:
Assoc. Const. 1/2/3: Enter the natural log of the desired association constant
in molar concentration units. Fields will be disabled for models that do not require
association constants.
Baseline OD: Enter the baseline concentration, if any for the
simulated experiment.
Loading OD Contrib.: The figure listed in this field is the contribution
to the optical density for the selected component. This number is calculated from
the molar concentration and the extinction coefficient. This number cannot be
changed by the user. If you want to change the value listed here, you need to adjust
the molar concentration or the extinction coefficient.
|
|
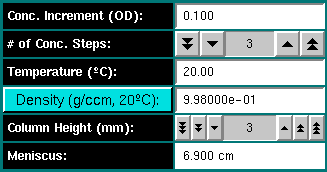
Conc. Increment (OD): Enter the concentration increment for multiple
loading concentrations. For a global equilibrium experiment, at least three
loading concentrations should be measured (for example, 0.3, 0.5, and 0.7 OD).
The increment should be listed in OD units.
# of Conc. Steps: Enter the number of desired concentration steps
for this experiment. For example, if three different loading concentrations
are desired click on the arrow buttons to select "3". The double arrow buttons
chnage the setting in steps of 10, the single arrow button in unity steps.
Temperature (oC): Enter the temperature in
degrees Celsius for the experiment. If different from 20oC,
the program will automatically adjust the vbar and density settings to
the new temperature.
Density (g/ccm 20oC): Enter the density of the
buffer for the simulated experiment. The density is entered in cgs units
for the buffer at 20oC. Clicking on the "Density" button
loads the buffer calculation module.
Column Height (mm): Select the column height in millimeter for
the experiment.
Meniscus: Displays the current meniscus position. The meniscus
position is automatically calculated from the column height and the cell
bottom position.
|
|
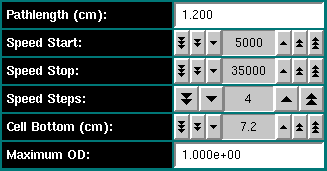
Pathlength (cm): Enter the centerpiece pathlength (in centimeters).
Speed Start: For a global equilibrium experiment it is recommended
to use multiple speeds. The correct speed depends on the molecular weight of
the component(s) to be simulated, and are best expressed in values of sigma
(reduced molecular weight) ranging between 0.5 and 4. The
Equilibrium Speed Estimation module can assist you in determining the
best speeds for your experiment. Use this field to enter the lowest speed
of the experiment. Use the arrow keys to select the speed. The single arrow
key changes the speed in steps of 100 rpm, double arrow keys change the
speed in steps of 1000 rpm, and triple arrow keys change the speed in
units of 10,000 rpm.
Speed Stop: Select the highest speed for this simulation.
Speed Steps: Select the number of different speeds used in this
simulation. The program will calculate equal speed intervals between the
Speed Start value and the Speed Stop value. If only 2 speeds are selected,
the Start Speed and the Stop Speed will be used. If one speed is selected,
the Start Speed only will be used.
Cell Bottom (cm): Enter the cell bottom position in centimeter
to define the geometry of the cell. The single arrow button changes the
position in units of 1x10<-3 cm, the double arrow button changes the
position in units of 1x10<-2 cm, and the triple button changes
the position in steps of 0.1 centimeter.
Maximum OD: Enter the maximum OD to be simulated in the experiment.
All data exceeding this value will not be displayed.
|

|
# of Datapoints: Select the number of datapoints for this
simulation. Each scan will be simulated with that many points, which will
be equally spaced wit the radial step size listed under "Radial Increment".
Gaussian Noise (% OD): Enter the percentage of the total optical
density to be simulated as random noise, with gaussian distribution. Single
arrow button clicks will adjust the noise level in steps of 0.01 OD percentage
points, double arrow button clicks will adjust the level in steps of 0.1 OD
percentage points, and single arrow button click will adjust it in steps of
unity. 0.1 - 0.3 percent of 1 OD are common values for the XL-A analytical
ultracentrifuge.
Nonlinear Noise (% OD): Enter the percentage of nonlinear gaussian
noise. This noise value will affect optical densities at higher values
more than at lower concentrations and reflects the instrumental noise
seen at higher optical densities in spectrophotometers. Values of 0.01 -
0.02 are common for the XL-A analytical ultracentrifuge.
|

|
Radial Increment: This value cannot be adjusted by the user and
reflects the radial stepsize resulting from the column height and the number
of datapoints selected for each scan.
Simulated Wavelength: This value has no effect on the calculations,
but is used when the data is exported to an external format.
Export as: XL-A/UltraScan: Select the export format for
the simulated data. "XL-A" format produces ASCII files of the type
generated by the Beckman data acquisition software (00001.ra1, 00002.ra1, ...),
while "UltraScan" format produces a binary output file suitable
for direct analysis with the UltraScan equilibrium modules.
|
|
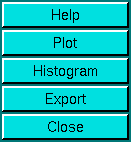
Help: Show this Help file.
Plot: Plot the simulated equilibrium scans in a
plot window.
Histogram: Plot a concentration histogram
for the total concentration of all scans in the simulated experiment.
Export: Export the simulated data to an external file format. See
"Export as:" for additional detail.
Close: Close this module and exit.
|


