
|
Manual |

When analyzing sedimentation velocity data with the
All plots show identical information, just presented in different ways.
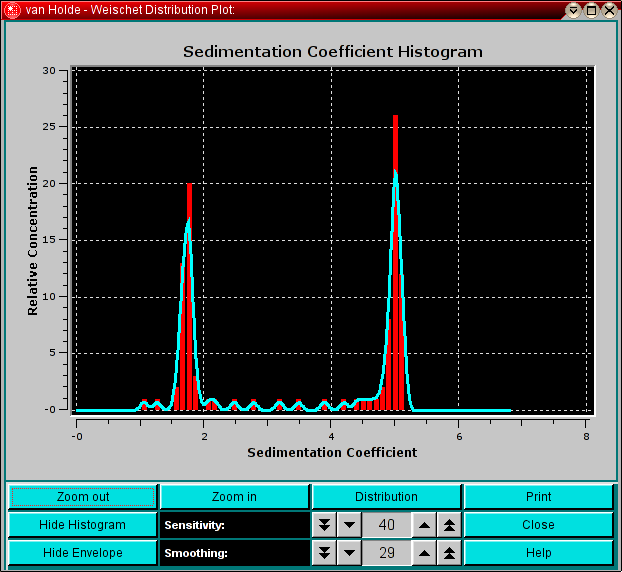
The appearance of the histogram and envelope plots can further be modified
by the sensitivity and smoothing controls:
This document is part of the UltraScan Software
Documentation distribution.
The latest version of this document can always be found at:
Last modified on June 24, 2003.

Zoom out
Allows you to zoom out of the plot by increasing the maximum scale and simultaneousely
decreasing the minimum scale range.
Zoom in
Allows you to zoom into the plot by decreasing the maximum scale and simultaneousely
increasing the minimum scale range.
Distribution/Histogram
Switches between display of integral distribution plot and histogram plot
Show/Hide Histogram
Allows you to toggle the display of the histogram plot, the envelope plot stays unaffected.
Show/Hide Envelope
Allows you to toggle the display of the histogram envelope plot, the histogram bar
plot stays unaffected.
Sensitivity:
With this counter you can select how many equally spaced S-value bins are used
to create the s-value distribution histogram. The larger this number, the higher
is the sensitivity of the histogram plot, but the lower the signal, and the noise
is increased as well since less signal averaging is performed.
Smoothing:
With this counter you can select the smoothing level of the histogram envelope.
With a small smoothing value the envelope follows the histogram plot very closely,
but produces erratic noise and nonsensical jitter. Increasing the smoothing level
is akin to the regularization control in the C(s) program from Peter Schuck, and it will
suppress minor peaks.
Print
Use this button to create a postscript plot or to send the plot image to the printer.
Close
Close this window
Help
Show this help documentation.
www contact: Borries Demeler
Copyright © notice