
|
Manual
|
2-Dimensional Spectrum Analysis:
The 2-dimensional spectrum analysis is used for composition analysis
of sedimentation velocity experiments. It can generate sedimentation
coefficient, diffusion coefficient, frictional coefficient, f/f0 ratio
and molecular weight distributions. The distributions can be plotted
as 3-dimensional plots (2 parameters from the above list against each
other), with the 3rd dimension representing the concentration of the
solute found in the composition analysis.
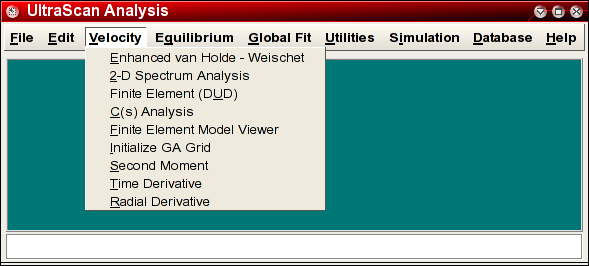
You can start the 2-dimensional spectrum analysis in one of two
ways: 1. by clicking on "2-D Spectrum Analysis" inside the Enhanced van Holde - Weischet method (the preferred
approach), or 2. by clicking on "2-D Spectrum
Analysis" in the Velocity sub-menu of the main menu.
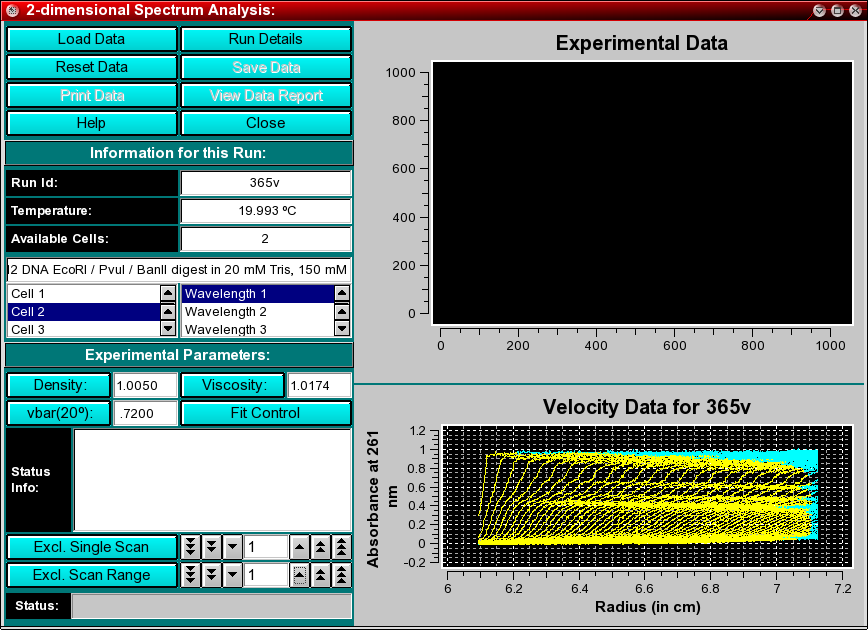
If you started the analysis routine from the enhanced van Holde -
Weischet analysis windows, the main data analysis
window will appear with the same dataset loaded that was analyzed by
the van Holde - Weischet analysis, and most parameters will have been
appropriately initialized.
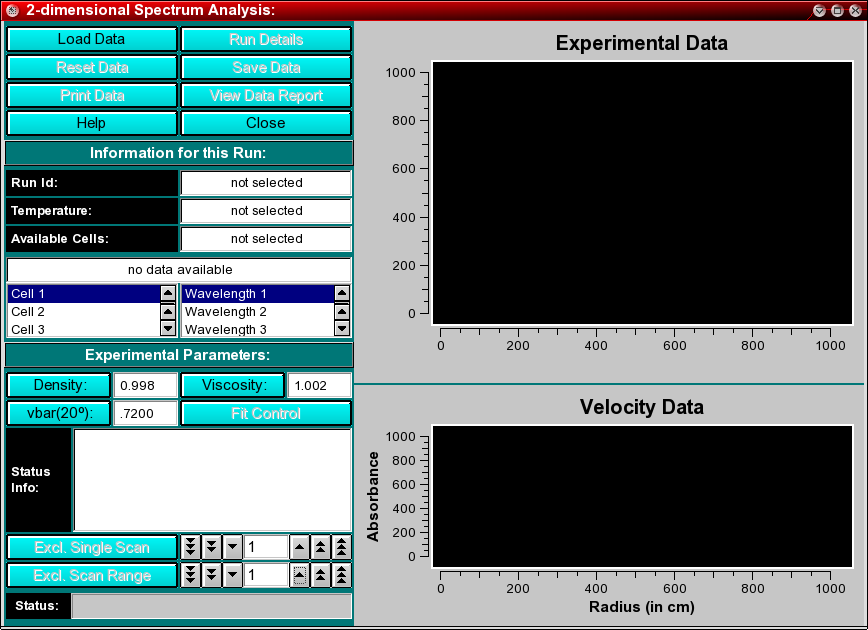
If you started the analysis routine from the main menu, the main data analysis window will appear without any data
loaded. In that case, you will need to load an UltraScan
dataset that has previously been edited with the UltraScan
editing module. UltraScan sedimentation velocity datasets
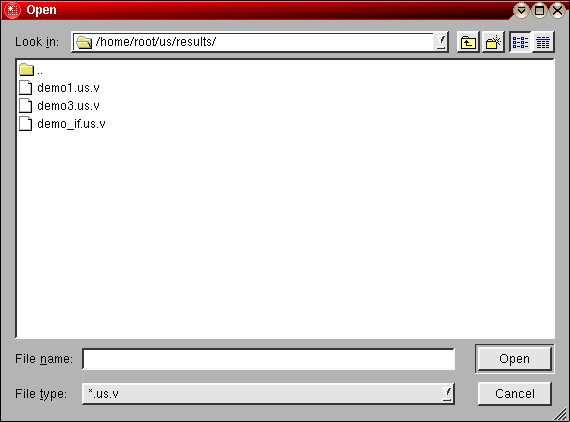
always have the suffix ".us.v". Click on the "Load Dataset" button in the
left upper corner of the control panel. Simply select the desired run from
the selection of available runs in the dataset
loading dialog. Once loaded, the Run
Details will be shown. Click on the "Accept" or "Cancel"
button, and you will be returned to the analysis
window, which will now show the available dataset of the selected
run in the edited data window on the lower right panel.
analysis window.
Analysis Functions:
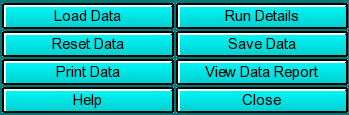 |
Click on these buttons to control the 2-dimensional spectrum analysis:
-
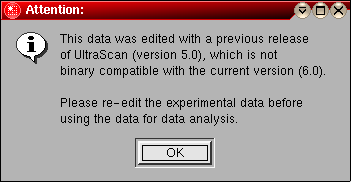
Load Data: Load edited data sets (with the *.us suffix). A
file dialogue will allow you to select a
previously edited and saved velocity experiment. If the data was edited
with an older version of UltraScan than the current, an error
message will be displayed.
-
Run Details: View the diagnostic details
for a particular run.
-
Reset Data use this button to reset the default settings for the
analysis.
-
Save Data: Write out a copy of all results to an ASCII formatted
data file suitable for import into a spreadsheet plotting program. See
"File Structures and Formats" for details.
Note: These files are overwritten each time this button is clicked. Only
the last version of the analysis will be saved!
-
Print Data: Load the printer control
panel for printing of plot graphics
-
View Data Report: See the data report for the last analysis setting.
Note: This file is re-written each time it is accessed. Only the current
analysis result is available.
-
Help: This help file
-
Close: Close the 2-dimensional spectrum analysis window.
|
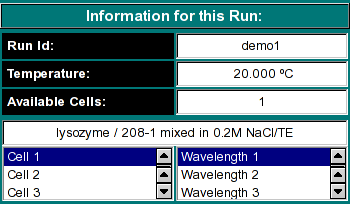
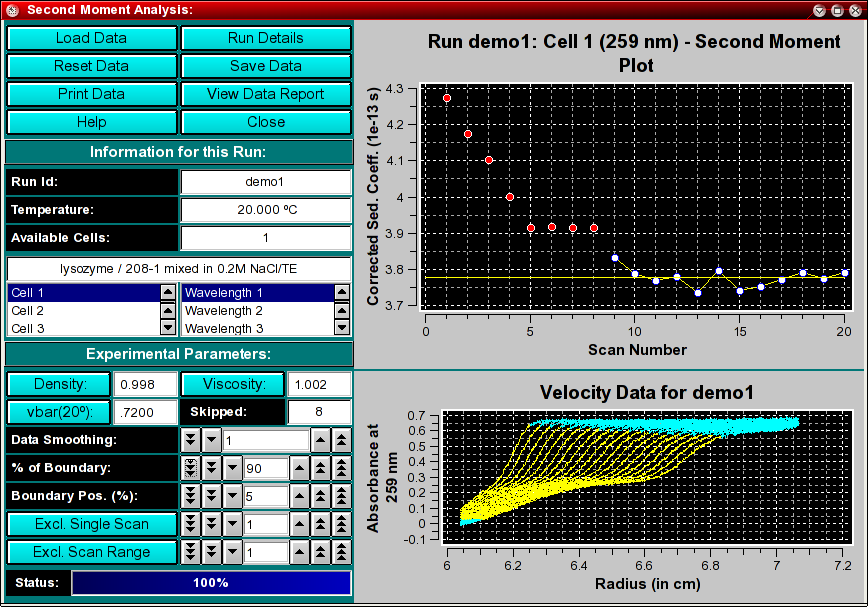
Run Information:
 |
-
Run ID: The name of the run given during editing
-
Temperature: The average temperature calculated from the entire run
-
Available Cells: The numbers the cells that contain analyzable data
Clicking on a cell and wavelength selection will bring up the cell contents
description for that cell and wavelength. Scroll through this list to bring
up information for cells > 3. If there is no data available for the selected
cell, the program will list "No Data available". Selecting a cell/wavelength
combination will automatically bring up the corresponding dataset and present
the analysis. |
Experimental Parameters:
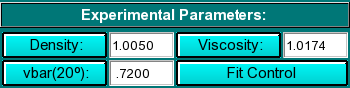 |
Here you can enter the corrections for density, viscosity, and partial
specific volume of your sample. As you change the information in these
fields, the program will automatically update the analysis to correct the
S-value according to the specified buffer conditions. If the data was
retrieved from the database and associated with the correct buffer file
and peptide file, the density, viscosity and partial specific volume (vbar)
will automatically be updated to the appropriate values and don't need to be
adjusted to produce S 20,W corrected values.
-
Density: Click to calculate the density
based on the composition of your buffer.
-
Viscosity: Click to calculate the viscosity
based on the composition of your buffer.
-
vbar(20o): Click to calculate
the partial specific volume for a peptide based on its primary amino acid
sequence and correct the vbar value for the current temperature.
-
Fit Control: Click here to open the fitting control window.
|
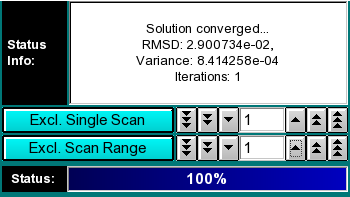
Analysis Controls:
 |
-
Status Info: This field contains information about the fitting progress.
-
Exlude Single Scan: When setting this counter to a non-zero value,
the respective scan will be highlighted in red. Clicking on "Excl. Single
Scan" while a scan is highlighted in red will delete this scan from the
analysis. Deleting scans from the analysis is irreversible and can only
be reset by clicking on the "Reset" button or by reloading the data (when
smoothing, the data is always automatically reloaded, causing the number
of scans to be reset to the original count). Skipped
scans are excluded automatically, because they haven't cleared
the meniscus. This is equivalent to scans whose first point has an
absorbance larger than the baseline (as defined by the baseline absorbance
selected during editing). Second moment points for these scans will
be displayed in red and excluded from the average,
which is displayed as a horizontal line in the second moment plot.
-
Exclude Scan Range: Same as "Exclude Single Scan", except
for multiple scans. To use this feature, select first the start scan
of the range by using "Exclude Single Scan", then complete the
scan range by using "Exclude Scan Range". The fewer scans are
included, the greater the effect of noise on the fit, but the fewer
megabytes of memory are used during fitting.
-
Status: The status bar informs the user about the progress of the
analysis. On slower computers this has more significance than on a fast
Unix machine.
|
Utility of the 2-dimensional spectrum analysis:
This method decomposes the velocity experimental data into a sum of non-interacting
finite element solutions, which provide information on sedimentation and shape. A
publication describing this method in more detail is in the works. More information
about this method will be provided in a future release.
www contact: Borries Demeler
This document is part of the UltraScan Software Documentation
distribution.
Copyright © notice.
The latest version of this document can always be found at:
http://www.ultrascan.uthscsa.edu
Last modified on July 17, 2005.